生殖&保健&個別化諮詢
內包裝:60 Cap軟膠囊
通路價 :NT$1600 HK$420
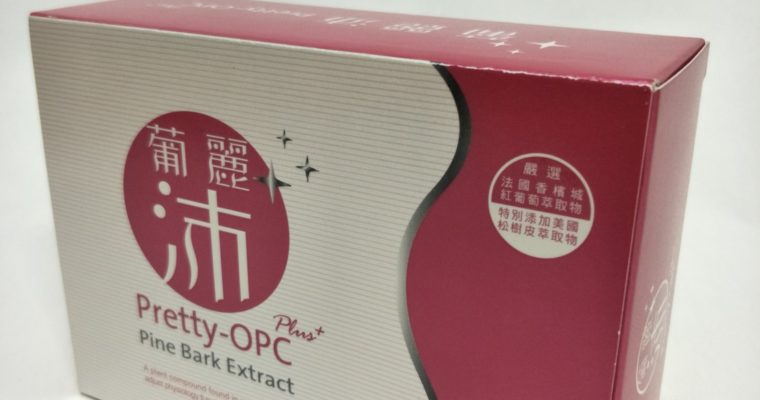
葡麗沛 (白藜蘆醇+松樹皮) 60顆 NTD$3200,HKD$865 […]
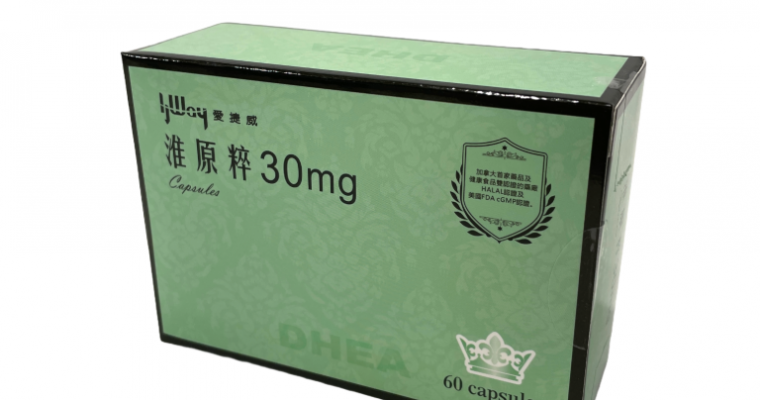
淮原粹DHEA 30MG (素膠囊)通路價 NTD$2200,HKD$580/60顆(素膠 […]
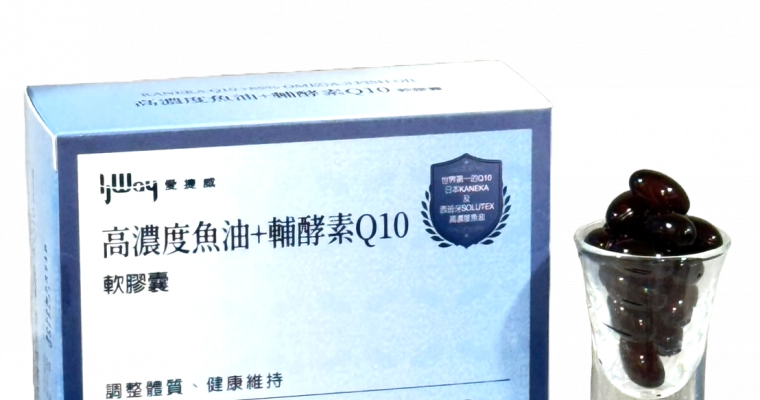
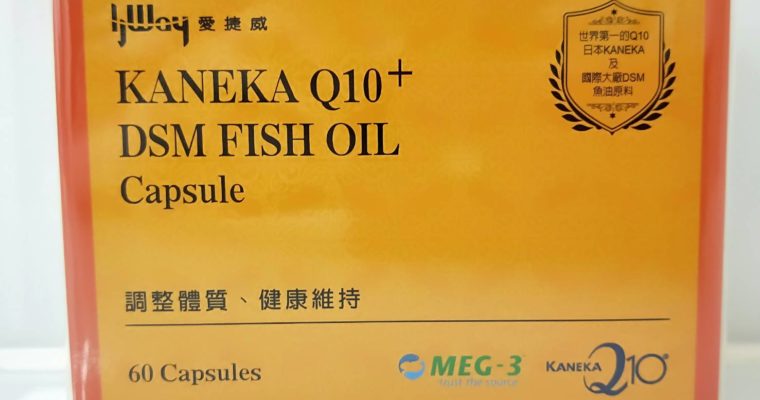
Q10+魚油 NTD$3200,HKD$865 DSM(Fish Oil) ONC(DSM […]
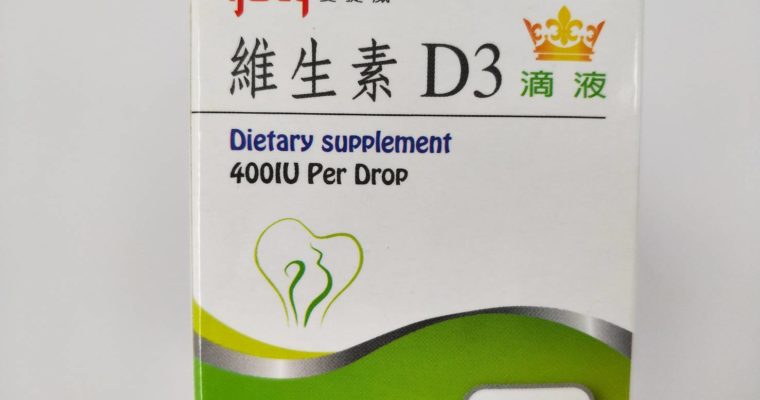
原粹維生素D3滴液 DIETARY SUPPLEMENT 400IU PER DROP N […]
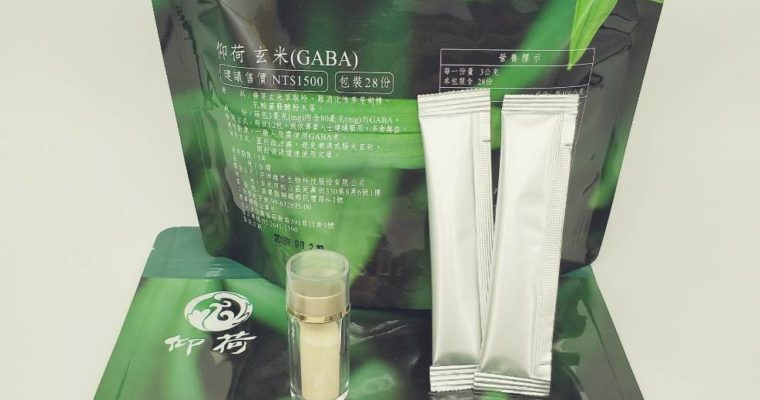
市售唯一以生物工法提煉發芽玄米中的營養品GABA每包共28小袋 諮詢價:NTD$1200/ […]
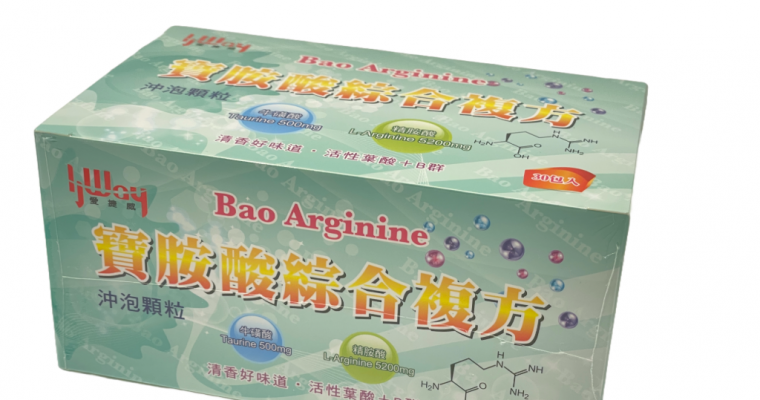
添加活性葉酸+維生素B群
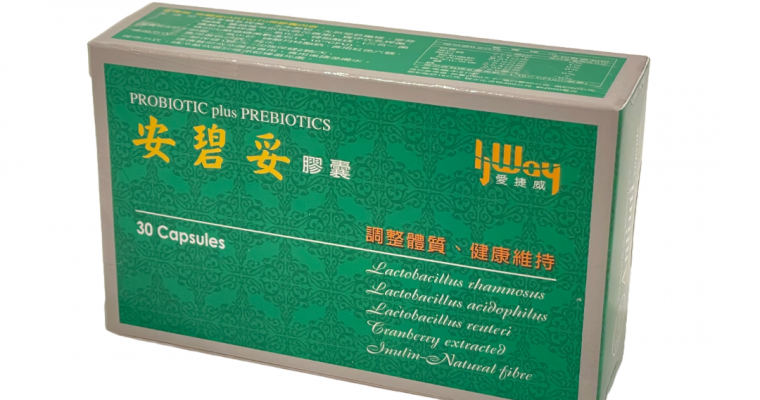
安碧妥(Antiuti) 益生菌膠囊 NTD$1800,HKD$485/30顆 (膠囊) […]
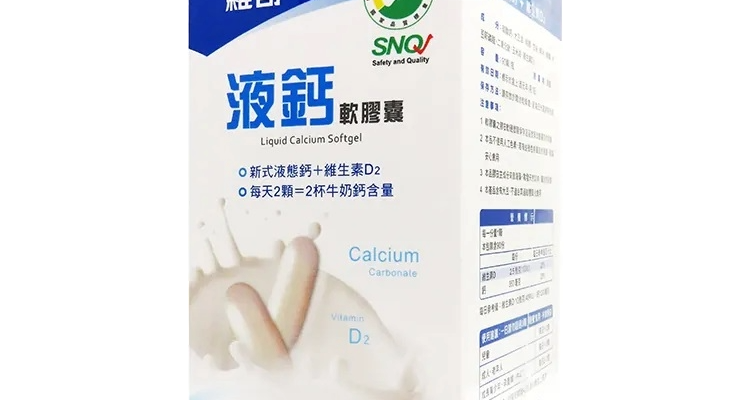
液鈣 VIT-GUTE(90顆) 通路價NTD$1,050/90顆,HKD$275/90顆 […]
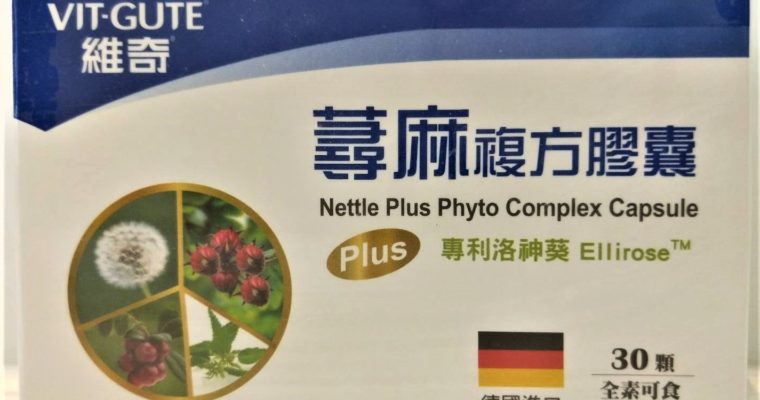
蕁麻草本PLUS (複方) (全新升級版) NTD$900,HKD$245/30顆 主成分 […]
我們知道會走到這兒來的姐妹們,大多數都已經在求孕路上走過一段傷痕累累的道路, 從一開始的滿 […]
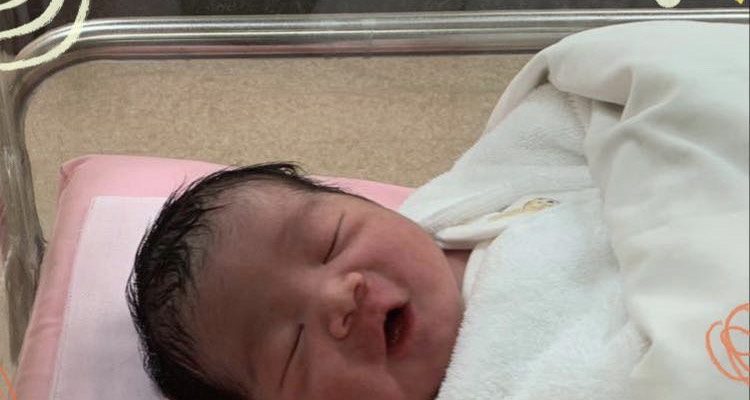
恭禧! 來自香港的Sherry媽咪好孕文 我的bb快要六個月了! 高fsh及低amh的我, […]
2019/5/5 愛捷威&中西醫 在香港~與您有約~ 🤩愛捷威5月份@香港🇭🇰聚餐 […]